Practical example: Incorporating the old sales statistics into the new dashboard
On this page you will find instructions on how to incorporate the old sales statistics into the new dashboard.
1. Creating configurations with the necessary key figures
Note: All the mentioned key figure configurations are either already available on your system or can be created free of charge.
You can create key figure configurations in the Setup » plentyBI » Key figure configurations menu.
For this example, you need five key figure configurations, three of which already exist in your system.
These are the key figure configurations that are already set up in your system:
This is how you create the other two key figure configurations:
Orders sent (Today)
-
Go to Setup » plentyBI » Key figure configurations.
-
Click on + New.
-
Enter a name for the configuration in the Name field, e.g.
Orders sent (Today). -
Select the Key figure
Orders (Live)from the list. -
Select Total as
Calculation type. -
Select the Dimension
Order. -
Set the following Filters: Order type » Corresponds to one of these values » Order, Multi order and Outgoing items booked »is equal to » Outgoing items booked today.
-
Save () the settings.
Revenue today
-
Go to Setup » plentyBI » Key figure configurations.
-
Click on + New.
-
Enter a name for the configuration in the Name field, e.g.
Revenue today. -
Select the Key figure
Revenue today (Live)from the list. -
Select
Gross revenueas Calculation type. -
Select the Dimension
Creation date. -
Do not set any filters.
-
Save () the settings.
2. Creating and setting up a new dashboard view
This step describes how to add the required key figure configurations to your dashboard.
Key figure configurations are displayed in the form of various elements in the dashboard.
You can add the required elements on an already existing dashboard view or create a new dashboard view.
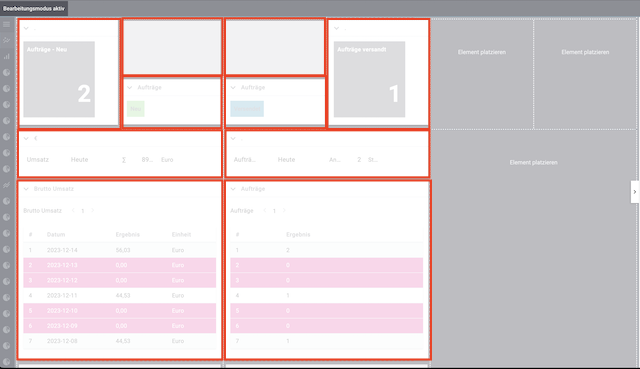
Use the editing mode () to customize sections and elements or to undo changes if necessary.
2.1. Customizing the dashboard layout
To customize the layout of the dashboard, set up the individual columns and rows.
To move or add the dividing lines, hover with the cursor over them and click on the three dots (more_vert).
Note: This is just an example of a dashboard layout. You can customize your dashboard according to your preferences.
2.2. Adding and editing elements
Once the display sections have been divided up, the second step is to fill them with data, which is displayed in the form of various elements.
Placing areas and elements on the dashboard:
-
Go to PlentyONE logo (Start) » Dashboard and click on Edit view ().
-
Select an element from the settings menu and place it on the dashboard by using Drag-and-drop.
Note: If you have already placed an area for the element on the dashboard, you do not have to add it again. In this case, drag-and-drop the desired element to the existing area and click on Edit () at the top right corner of the element. -
Move the cursor over the element and click on Edit ().
→ The settings menu opens.
→ The possible elements for the area are displayed. -
Select an element from the settings menu and drag-and-drop it within the area on the dashboard.
-
Save () the settings.
2.2.1. Settings for the individual elements
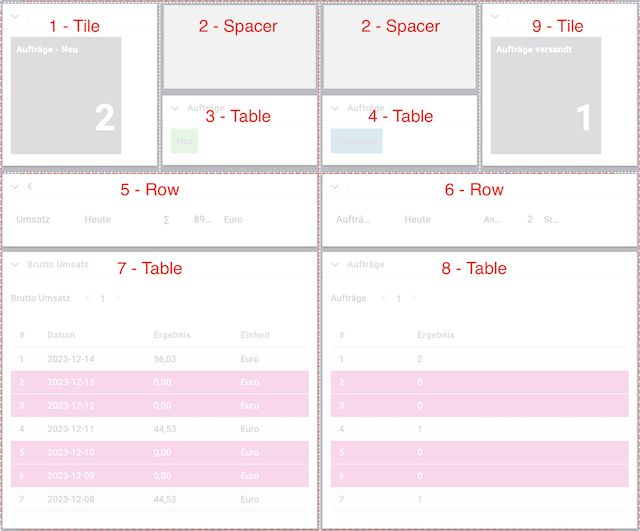
Below you will find the settings for the elements shown in the image above.
Note: You can set your own title and colour for each element.
Tile - 1
Settings for the tile:
-
Key figure: Orders (Live)
-
Title: Orders - New
-
Period: Today
-
Aggregate: Count
-
Time interval: Day
-
Primary value: Key figure value
Spacer - 2
Settings for spacers:
-
Height: 125 px each
Table - 3
Here we added a table and then a button within the table.
Settings for the button:
-
Title: New
-
Shortcut type: Open link
-
Link: /order/order-ui/overview?createdAt={"value":"today","operator":"period"}&orderTypeId={"value":1,"operator":"in"}
Note: All links to other UIs may change at any time and may be invalid while you are reading this. If this is the case, we recommend that you create a ticket in the Service Desk. -
Colour: Green
Table - 4
Here we added a table and then a button within the table.
Settings for the button:
-
Title: Sent
-
Shortcut type: Open link
-
Link: /order/order-ui/overview?orderDate_5={"value":"today","operator":"period"}
*Note*: All links to other UIs may change at any time and may be invalid while you are reading this. If this is the case, we recommend that you create a ticket in the Service Desk. -
Colour: Grey
Row - 5
Settings for the row:
-
Key figure: Revenue today
-
Title: Revenue
-
Period: Today
-
Aggregate: ∑
-
Primary value: Key figure value
Row - 6
Settings for the row:
-
Key figure: Orders (Live)
-
Title: Orders
-
Period: Today
-
Aggregate: Count
-
Primary value: Key figure value
Table - 7
Settings for the table:
-
Key figure: Gross revenue
-
Title: Gross revenue
-
Period: 7 days ago - yesterday
-
Time interval: Day
-
Sort order: Scale basis - Ascending
-
Aggregate: ∑
-
Items per page: 25
-
Group by dimension: Enabled
-
Mapped column: Scale basis
-
Mapped column: Primary result
-
Mapped column: Result unit
-
Decimal places: 2
-
Conditional colouring: (settings) » Data field » Primary result » Lower than » Fixed value » 1
Table - 8
Settings for the table:
-
Key figure: Orders
-
Title: Orders
-
Period: 7 days ago - yesterday
-
Time interval: Day
-
Sort order: Scale basis - Ascending
-
Aggregate: ∑
-
Items per page: 25
-
Group by dimension: Enabled
-
Mapped column: Primary result
-
Decimal places: 0
-
Conditional colouring: (settings) » Data field » Primary result » Lower than » Fixed value » 1
Tile - 9
Settings for the tile:
-
Key figure: Orders sent (Today)
-
Title: Orders sent
-
Period: 30 years ago - today
Note: In our example, we set the time period to 30 years ago - today. The reason for this is that we want to see orders regardless of the creation date, especially those for which the goods issue posting was made today. The filter that was originally set in the configuration for the booked goods issue, together with the setting of the time period to day on the tile, allows us to do this. Of course, you can decide for yourself which time period you want to set.
-
Time interval: Day
-
Primary value: Key figure value
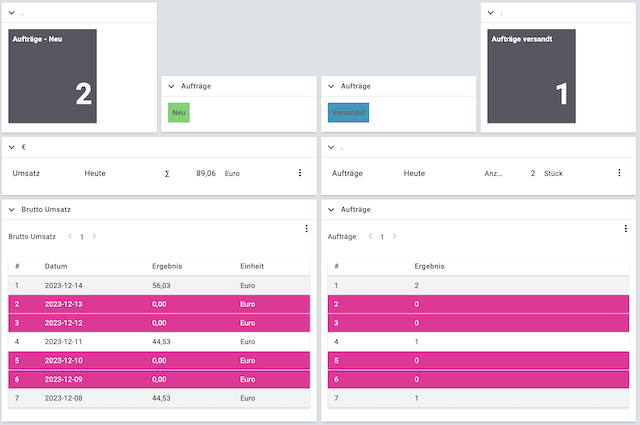
This is our result: